Data source: NYC 311 data 2010 to present: https://data.cityofnewyork.us/Social-Services/311-Service-Requests-from-2010-to-Present/erm2-nwe9/about_data
Bike Icon: Icon by Creative Squad :https://www.freepik.com/icon/bike_11082758
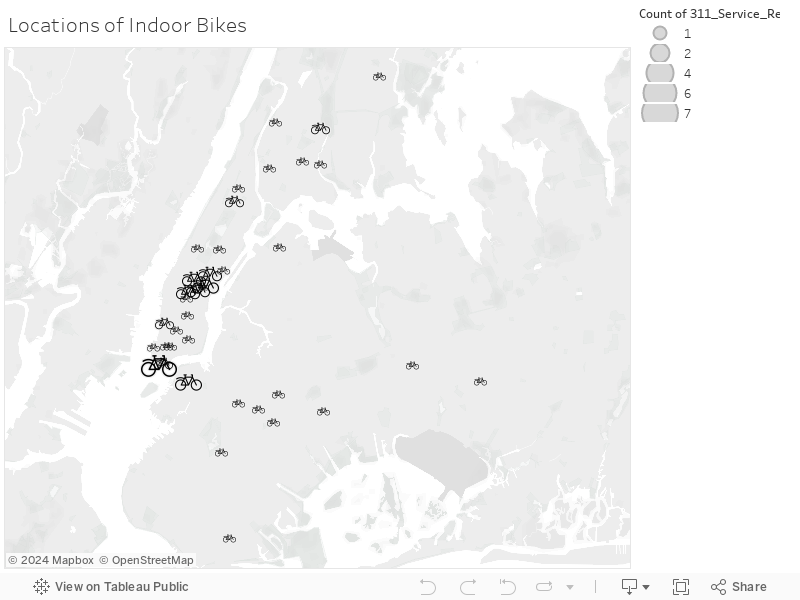
I decided to look at 311 data for Bikes. There more reports then I anticipated. Complaints of snowy or icy bike lanes, chained bikes and even reports of bikes in buildings. From 2010 to present (April of 2024) there were 62 cases of bikes reported in buildings. Take a look at the visualization. The larger the bike icon the more reports of bikes in buildings at that location.