Data is Fun

Where Data is Fun

  • Free AI Talks

    The Columbia Journalism School Chair is offering six 90 minute Zoom sessions on AI for investigative Journalism for free. Starting this Tuesday, April 16th, it runs on Tuesdays and Thursdays. The talks are suggested for journalists, but from the descriptions they are applicable to analysts too. Read more and get a free ticket here: Practical…

  • Signs in NYC

    Here is another chart on complaints in NYC. This time it is about damaged or missing street signs. Specifically, the data is broken down into 3 categories: Damaged, Dangling and Missing. As per the chart, the “No Parking, Standing, Stopping” signs are most frequently reported missing. This data is from 2010- April 5th 2024 ….

  • Bed Bugs In NYC

    Reports of bedbugs in NYC. From 2019-2024. Looking at the charts it looks like a lot of bedbugs are reported at EOY around the winter months. Notice there is one zip code in queens that reports a lot of bedbugs. It is zip code 11385 which corresponds to Ridgewood, NY. Click on the charts to…

  • Looking at 311 calls about Pigeons

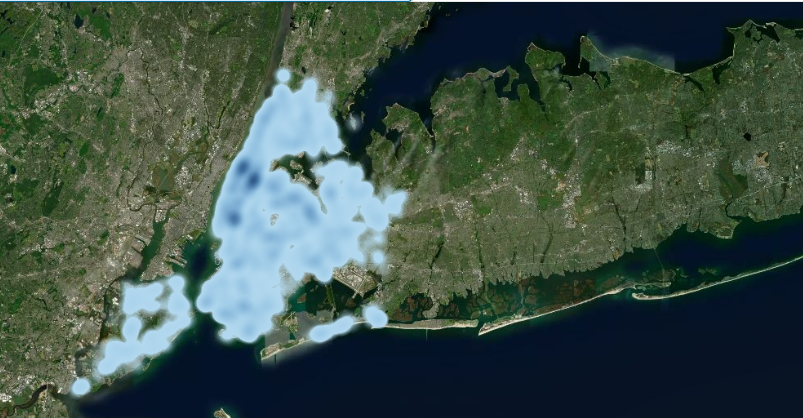
    Using NYC 311 complaint data pigeon complaints were explored. Complaints included individuals complaining about pigeon waste, or pigeon odors. For this visualization only the March 1-10th 2024 period was explored. The darker the color, the more complaints. Notice that Manhattan and Brooklyn have a few hot spots for complaints. This again raises the question are…

  • Items left in NYC Taxi

    A look at 311 data and items reported left behind in NYC Taxis. The two large dots correspond to the airports (LGA & JFK). It seems surprising that there aren’t many items lost in Staten Island or reported lost. Looking at what is left behind wallets, glasses, and phones are commonly left. It is surprising…

  • FDNY LOCATIONS

    Locations of FDNY (Fire Department of New York) in NYC.